Last year we chose the top ten best infographics for 2016, a post which has proven to be our most enduring measured by the number of unique readers.
This year, in compiling our assessment, it is hard to go past the work of Tim Leong, whose book, “Super Graphic – A Visual Guide to the Comic Book Universe” only reached our awareness this year (despite being published in 2013 – we were behind the curve).
As required by list etiquette, we place these in reverse order. And as with last year, if we have incorrectly described the creator / origin of these infographics, please let us know and we will fix the error.
10. The Many Faces of Superheroes (Pokies.net.au)
This up-to-date visual list of actors who played various characters in superhero motion pictures is dynamic and compelling. It is also insightful: some actors are clearly devoted to the genre, appearing as different characters in different movies.

9. A Venn Diagram of Superhero Comic Tropes
A clean, funny Venn representation from Tim Leong, combining both silly and black humour.

8. Quinjet v Blackbird
Another Tim Leong comparison, looking at the iconic aircraft of the two main superhero teams in Marvel Comics’ stable. It turns out that despite the backing of billionaire Tony Stark, the X-Men have the better plane.

7. Banned Comics (Comic Book Legal Defence Fund)
A much more serious infographic, beautifully setting out which comic books have been banned by US libraries, and the reason why.
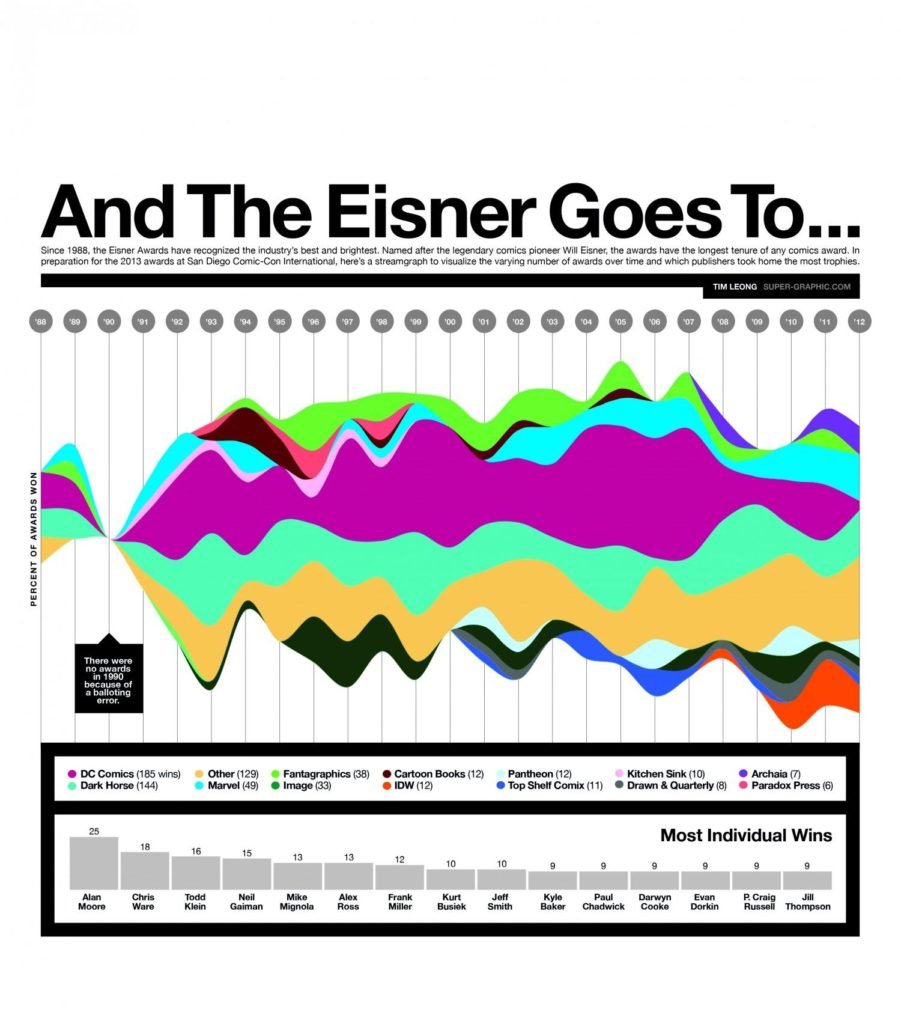
6. Eisner Awards
Our third infographic from Tim Leong, clearly demonstrating the dominance and influence of Alan Moore upon the US comic book industry, and the quality and vibrancy of independent publishers.
5. History of the Batmobile (ComicBookResources.com)
A wonderful infographic, meticulously detailing the evolution of the Batmobile (the iconic vehicle driven/operated by DC Comics’ Batman) from winged car to high velocity tank.
4. Top 15 Most Popular Marvel Comics Characters (Max Woorf)
A very clean, simple analysis of solo appearances by Marvel Comics’ characters, led by the evergreen Spider-Man, but with some genuine surprises towards the end of the list.
3. Could We Really Build Giant Robots? (Karl Tate / TechNewsDaily.com)
Bleeding out of the genre of manga and into anime and live action motion pictures, engineering party-pooper Karl Tate sadly debunks the dream of building giant robots.
2. Manga Storyline Visualisation (unknown)
For literary buffs, a very simple visualisation of plot developments in key manga titles, with a punchline to making those in the know smirk.
1. One Piece by the numbers (Flutter Scape)
Pirate epic One Piece dominates all. This infographic clearly indicates the degree of popularity of this shonen manga, broadly unknown outside Japan. This tops our list, because of the clarity of demonstrating the manga’s enormous market leadership in Japan.
And finally, included out of self-indulgence, not in the list, and indeed cut from a longer infographic, one to baffle long-time readers of Marvel Comics’ Uncanny X-men. It turns out that Wolverine’s 1980s brown costume is the version which has most frequently appeared in Marvel Comics’ publications.


